Introduction
The purpose of this lab was to build two simple webpages using Hypertext Markup Language (HTML), Cascading Style Sheets (CSS), and JavaScript. This was done using Notepad + + and referencing different aspects of the webpage (HTML for functionality, CSS for aesthetics, and JavaScript for dynamics). Part 1 of this lab was focused on building a "test page" to get familiar with how the three pieces work together. In part 2, the goal was to build a webpage for a hypothetical GIS company. The page had to contain the following:
- The name of the company
- A company logo
- Useful links for end-users/clients
- Link to Natural Disasters Web App created in Lab 3
- Links to two other Web Apps with preview images
- A list of six services that the company provides
- A website search bar
Methods
Part 1
For part 1 of this assignment, the goal is to become familiar with different aspects of a webpage and how to code them. Start by opening a new document in
Notepad + +. Label the document as an HTML code by typing
<!DOCTYPE html> in the first line. Save the document in the appropriate folder as an .html file, give it an appropriate name. Now Notepad + + will know to use html syntax for this document. Next, enter the code shown in figure 1.
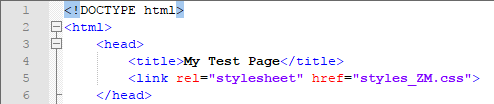 |
| Figure 1: Create tab head for website. |
The
<head> tag creates the websites tab so that when an end-user has the website opened in their browser along with others, they can refer back to the tab which will read "My Test Page" and will be able to navigate back to your website. The
<link> tag connects this HTML code which contains most of the webpage's content, to a CSS script that will be created a little later.
Now that the tab title has been created, enter the code shown in figure 2 starting with the
<body> tag.
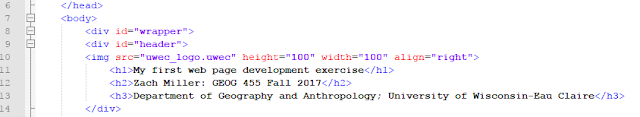 |
| Figure 2: Create header for body. |
Using the
<div> tags compartmentalizes the webpage and allows the programmer to divide the page into smaller workable sections. The
<img> tag places the UWEC logo (taken from the same folder used to store this .html file) in the top right corner of the webpage. The
height, width, and
align parameters allow the programmer to adjust those image properties. The next three lines in figure 2, serve as the webpage's heading and subheadings (see figure 3). The
<h1>,
<h2>, and
<h3>
tags adjust the size of the heading and subheadings text.
 |
| Figure 3: Webpage heading. |
Now that the top of the website has been built, the body of the page is next. For this section, start off with a
<div> tag to place the following paragraph tags (<p>), shown in figure 4, within the body of the page instead of the heading. Give this divider tag an
id = main statement. This will be referenced for style settings of this section in the CSS code.
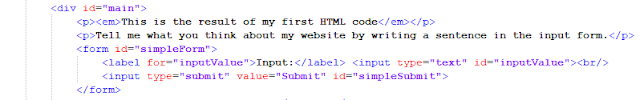 |
| Figure 4: Building main body text and search form. |
In figure 4, there are two lines of text, denoted by the
<p> tags, that will read "
This is the result of my first HTML code"and "
Tell me what you think about my website by writing a sentence in the input form". Then, using the
<form> tag, create a search bar (made of a submit button and input box) as shown in figure 4.
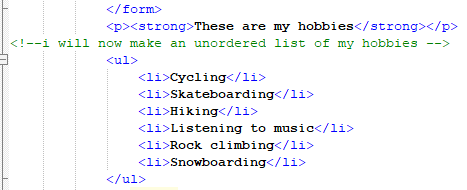
The next segment of this code will incorporate an unordered list, using the <ul> and <li> tags shown in figure 5. The <ul> tag creates an unordered list while the subsequent <li> tags create bulleted list items.
 |
| Figure 5: Create an unordered list. |
Start by creating a new paragraph, bolding the text "
These are my hobbies". The
<strong> command creates bold text. Add a comment below this (shown as green text in figure 5) as a reminder of what the following code does, then list six or so hobbies.
Next, create a large separation in the content by using the
<p> </p> tag shown in figure 6. Add some text in a new paragraph that explains your excitement for coding. Attach a hyperlink to the UWEC Geography & Anthropology department directly following that. Give the hyperlink a display label of "
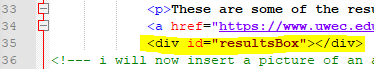
Web GIS". Lastly, to finish off this section, add another
<div> tag with an
id="resultsBox" statement. This will be referenced later using JavaScript to create a text box in that location.
 |
| Figure 6: Create new section of webpage with link. |
To get familiar with adding images to a webpage, practice by starting with a comment (figure 7). Again, commenting when coding helps the programmer to remember what each part of the code is doing, which helps when revising and/or debugging the resulting webpage. Then, place a new paragraph in the code describing the picture about to be placed into the webpage. The picture will be a thumbnail image of the Web App created in the last assignment, Lab 3. It would be helpful to provide a link for the end-user to actually visit the working web app, so include a link to the
application as well. Now, the main body of our page is complete, so throw in a closing
</div> tag to finish it off (see figure 7).
 |
| Figure 7: Placing a picture and link to Natural Disasters web app created in lab 3 into body of webpage. |
We're almost done with the HTML for this webpage, but first a footer displaying temporal relevance of this webpage and credits for the code format will be added. Start with another
<div> statement and add text with today's date on it. Create a large separation using a
<p> </p> tag and lastly a link to the resource this code was extracted from.
Always cite your sources (see figure 8).
 |
| Figure 8: Add footer content. |
Finish this code by closing the
</body> and
</html> tags, ensuring to line them up with their respective opening tags (see bottom of figure 9).
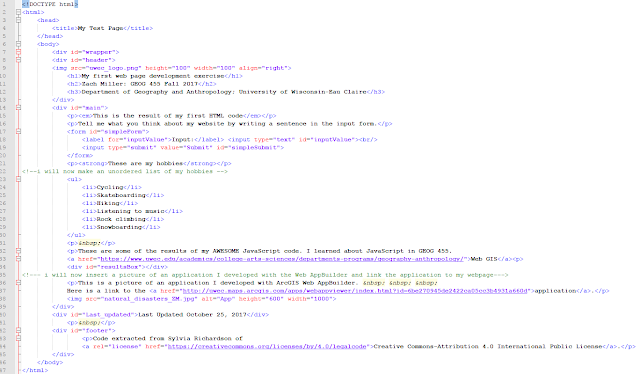 |
| Figure 9: The (almost) finished HTML code for the webpage. |
Double-click this .html file in the folder you saved it in and view your webpage (figure 10).
 |
| Figure 10: Resulting webpage thus far. |
Although, the webpage is coming along well and there is a good amount of content, the page looks very bland. Now, we will employ CSS code to give color to the webpage.
Start by creating a new file in
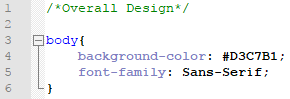
Notepad + + the same way you did before, only this time you will save it in your folder as a .css file. Write a comment at the top of the code that says "
Overall design". Begin designing the body of the page. Choose a background
color and "
font-family" (CSS will pick a font for you). Since we're coding in CSS language, the syntax is a little different than HTML (see figure 11).
 |
| Figure 11: Creating a style sheet. |
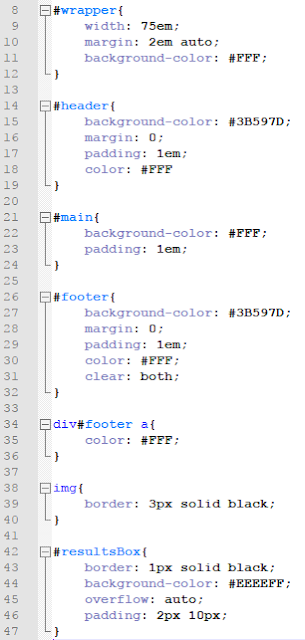
Now, code all of the aesthetic settings of the page divisions that were made in the html code. These sections include:
- Wrapper
- Header
- Main
- Footer
- Images
- Results Box (soon to be coded with JavaScript)
 |
| Figure 12: Setting aesthetics for different segments of the webpage based on <div> id. |
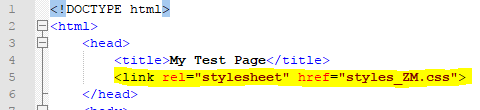
There are many different settings the programmer can apply to their webpage, as seen in the image above. In order to apply these settings to your HTML code, save this CSS file and re-open the HTML file created earlier. Add a statement underneath the <title> tag to connect to the CSS file (figure 13).
 |
| Figure 13: Connecting the CSS file to the original HTML code. |
Much like the hyperlinks to the UWEC Geography & Anthropology site and your Lab 3 web app embedded in the HTML code, enter a
<link> statement with the file name of the CSS sheet that's stored within the working folder. Visit the webpage and view the changes that adding this CSS file made to your webpage (figure 14).
 |
| Figure 14: Webpage with CSS styling. |
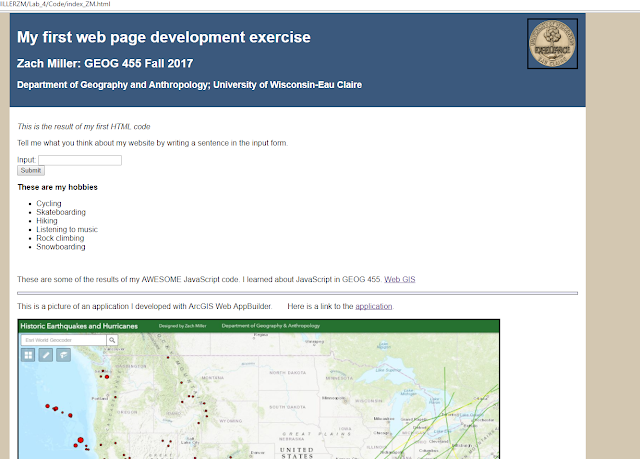
That's more like it! Notice in figure 14 that the UWEC logo in the top right corner and the thumbnail image at the bottom have a black border around them. Also notice the blue heading, beige background, and (unfinished) results box which currently looks like two lines above the caption for your web app thumbnail. This will be filled-in by creating and linking a JavaScript file to the original HTML.
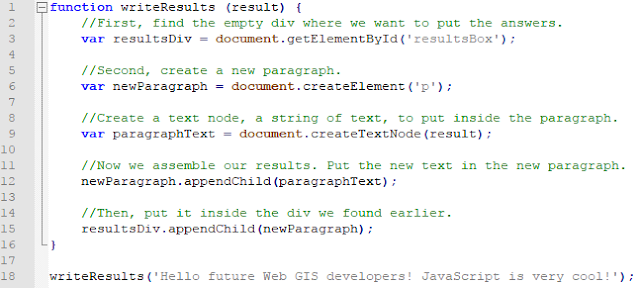
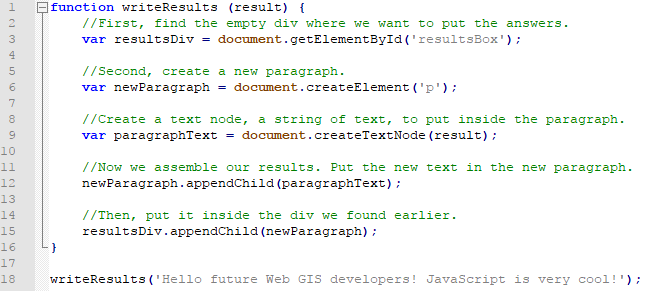
Open yet another new Notepad + + document and save it in your working folder as a JavaScript file (.js). Give it a conventional name to be easily referenced in the HTML code. Start by creating a function called "writeResults" (see figure 15).
 |
| Figure 15: JavaScript code that will display the function writeResults' associated text. |
Within the function shown in figure 15, there are variables (
var). These tell the function how to run, and in this case, create a text box and place whatever the input of the text parameter is when the function is called (see bottom
writeResults function). Once again, save this JavaScript file and reference it in the original HTML code (figures 16 and 17).
 |
| Figure 16: Placement of results box in webpage. |
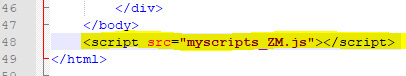 |
| Figure 17: Calling the JavaScript function to actually display the text box where it was placed in figure 16. |
With that last bit, this web site is complete for now. There is always room to add more to this webpage, however, for the purposes of understanding website building basics, this exercise has done its job.
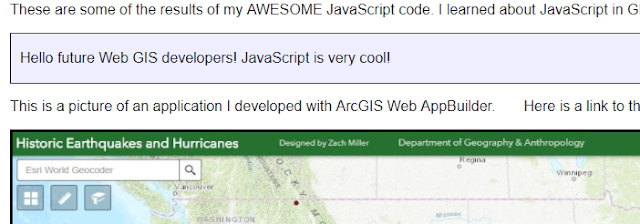 |
| Figure 18: Results box in webpage. |
Part 2
Now that we have the basics of building a webpage with HTML, CSS, and JavaScript down, build your own webpage that meets the criteria listed in the
Introduction section. Figure 19, 20, and 21 show the CSS and HTML code, and the resulting webpage for this part of the assignment.
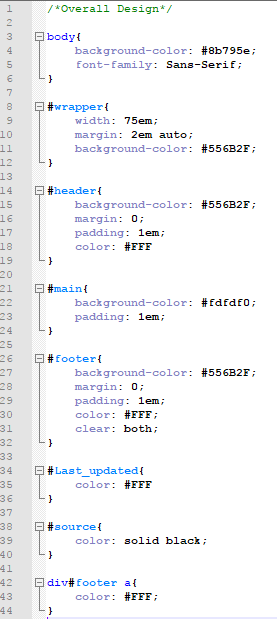 |
| Figure 19: Finished CSS code for ScienceWhere GIS page. |
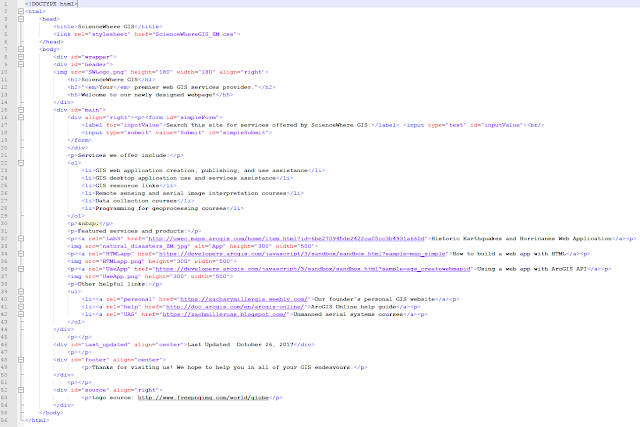 |
| Figure 20: Finished HTML code for ScienceWhere GIS webpage. |
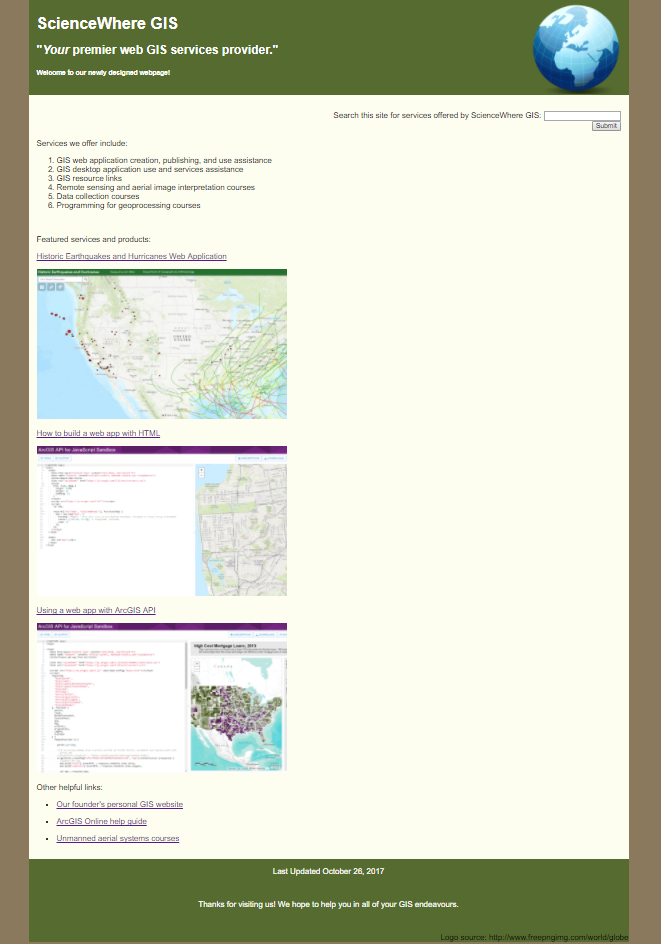
Results
 |
| Figure 21: Resulting ScienceWhere GIS webpage. |
For the most part, the layout of the hypothetical ScienceWhere GIS webpage is the same as the test webpage created in part 1 of this lab. Like the site search bar and footer text were repositioned to fill more space; adding a few align parameters in their <div> tags was all that was needed for that. Another thing that was different was using an ordered list instead of an unordered one like that made in part 1. The only change that was required to perform this action was using a <ol> tag instead of a <ul> tag. The most obvious change to this website versus the test site is the color, but again, some simple changes to the CSS code were made to create a different feel for this site.
Discussion
Overall, I think I learned quite a bit about HTML, CSS, and JavaScript fundamentals with this lab. Although rudimentary, I'm fairly proud of the sites I created. I still acknowledge, however, they could use some serious work. Perhaps adding more JavaScript dynamic aspects to the page would create a better use of space on the page, as well as: multiple tabs, objects, and colors. For what it's worth, using HTML, CSS, and JavaScript to create a webpage really helps to understand the nuts and bolts of how webpages function, are accessed, and created.


