Introduction
The purpose of this lab was to develop mobile responsive apps that are comprised of
Volunteered Geographic Information (VGI). VGI is geographic data that is contributed by end-users of an application- in this case, to document the condition of fire hydrants, sidewalks, and green spaces. Using an attachment function, the end-user can upload pictures of the feature/s they're uploading.
Methods
Part 1:
In order to allow end-users to upload information to a map, they must have a map with features to access and update. In the first part of this lab, a map containing three feature classes was created in ArcMap, published as a service, and enabled feature access. This was done by first
creating new feature classes in a
geodatabase (figures 1 and 2).
 |
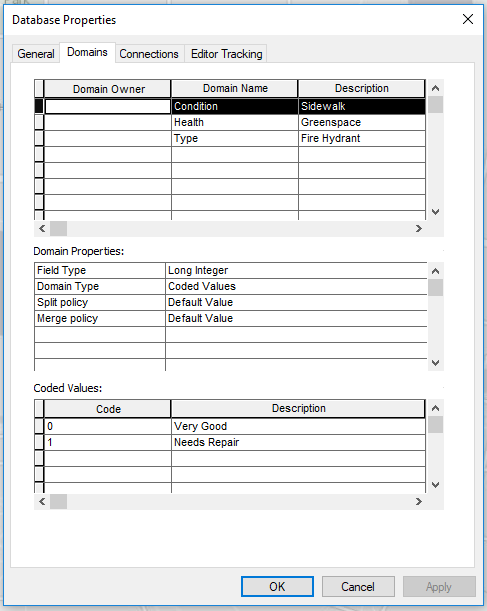
| Figure 1: Establishing domains and subtypes for feature classes. |
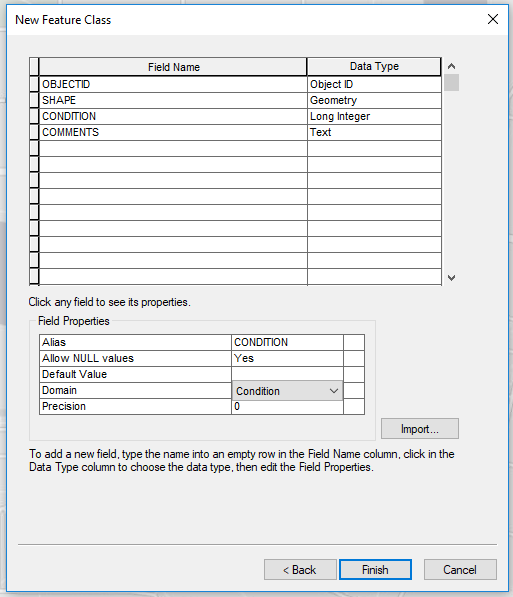
In figure 1, rules for the feature classes to be added to the geodatabase are established, the coded values (options for an end user to select) are created, and data types for feature classes are set. Once this was done, the new feature classes were added to the geodatabase (figure 2), using the parameters set in the previous step.
 |
| Figure 2: Creating a new feature class. |
Next, an attachment option was created (figure 3) for the sidewalk and fire hydrant classes. This setting would allow end-users to add attachments to their uploaded features in the resulting webpage app.
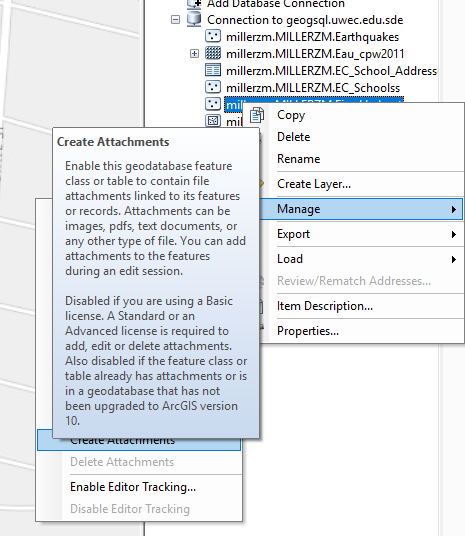 |
| Figure 3: Create attachment capabilities. |
Now, the end-user can add features and attachments to those features to the map (figures 4 and 5).
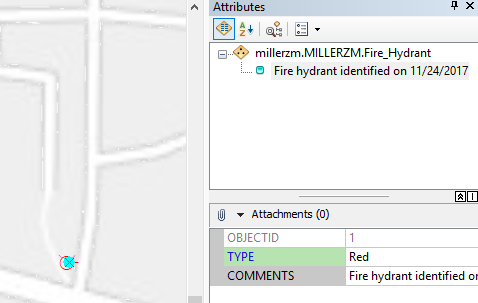 |
| Figure 4: Add fire hydrant point feature to map. |
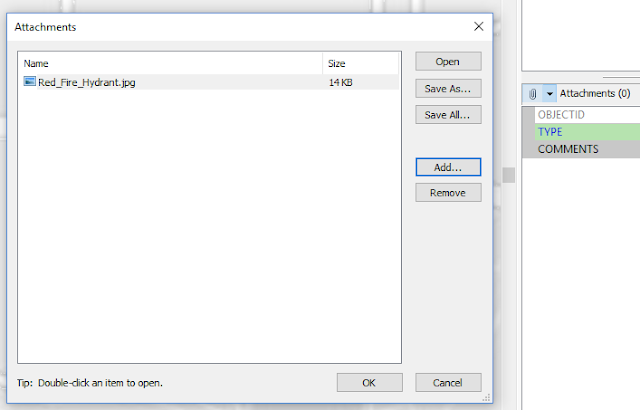 |
| Figure 5: Attach picture to user-plotted point. |
Then, the map was published to a local server to be accessed as a service in the following code.
Part 2:
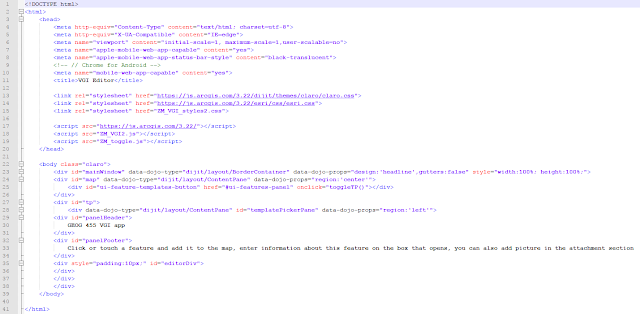
Essentially the same code for the latter two parts that make up this lab was used, with a few modifications to add a toggle button to open/close the attribute upload window for users to contribute VGI. The first HTML code used (figure 6) establishes the webpage content and references the stylesheets and other code used to give functionality to the webpage.
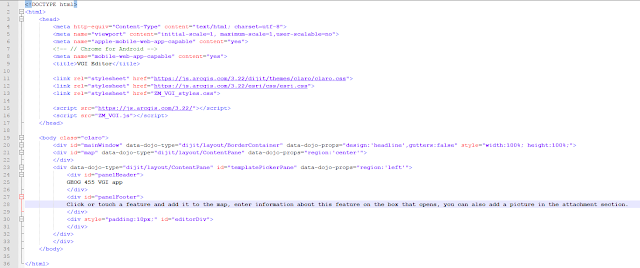 |
| Figure 6: HTML document. |
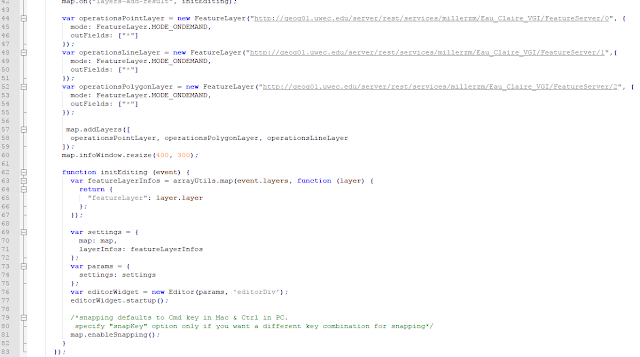
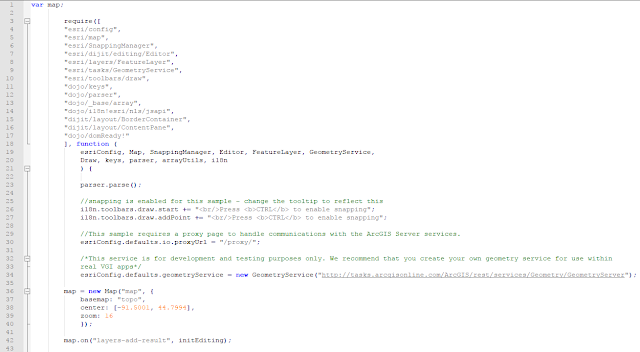
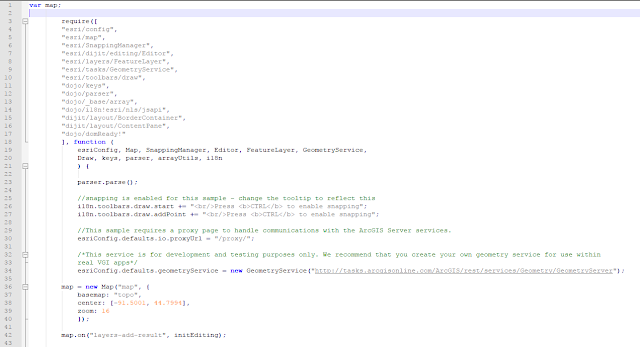
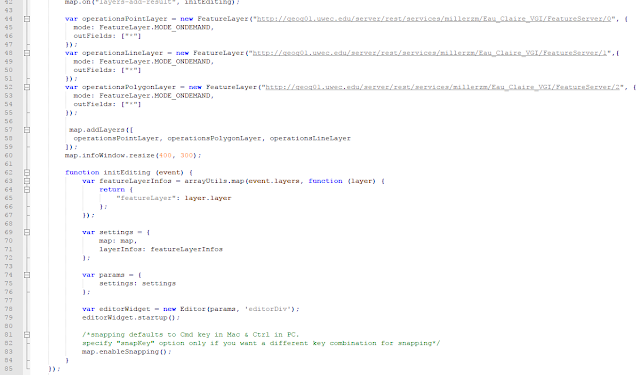
The next section of code was a JavaScript document (figures 7 and 8) which gives the webpage its functional elements such as accessing the necessary Dojo libraries, enabling end-users to add features to the map, and ensuring topology integrity of line and polygon features.
 |
| Figure 7: JavaScript document (1/2). |
 |
| Figure 8: JavaScript document (2/2). |
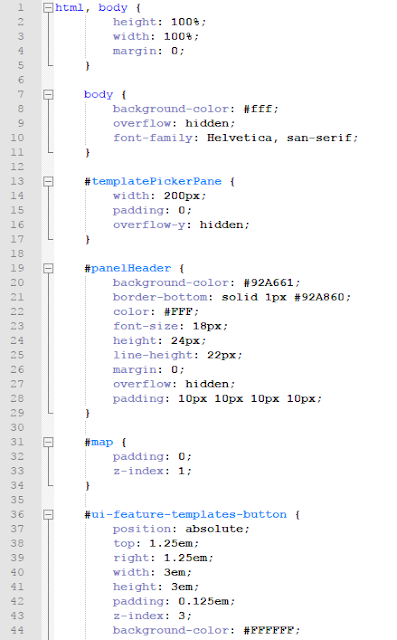
Next, a CSS document was created to establish sizes and aesthetic features of the webpage (figure 9).
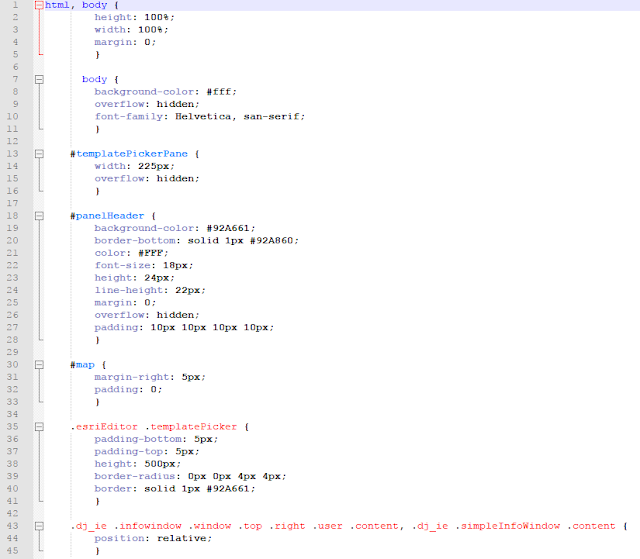 |
| Figure 9: CSS document. |
Once all of these documents were created, the html code was launched. This resulted in a webpage where users can access feature layers to upload and attach images to (see Results section).
Part 3:
For the last part of this lab, the original HTML, JavaScript, and CSS documents were copied and edited an another JavaScript document was created to enable the toggle feature added to this section. The HTML code received a few changes which include: an Apple status bar in the apple mobile app configuration of the webpage, reference to the toggle JavaScript document, and a window for the toggle function (figure 10).
 |
| Figure 10: HTML document. |
Next, the original JavaScript code was copied and used again for this section (figures 11 and 12).
 |
| Figure 11: JavaScript document (1/2). |
 |
| Figure 12: JavaScript document (2/2). |
Then, the original CSS document was modified to include a template picker pane styling, a toggle on/off button, and the feature layers window styling (figures 13 and 14).
 |
| Figure 13: CSS document (1/2). |
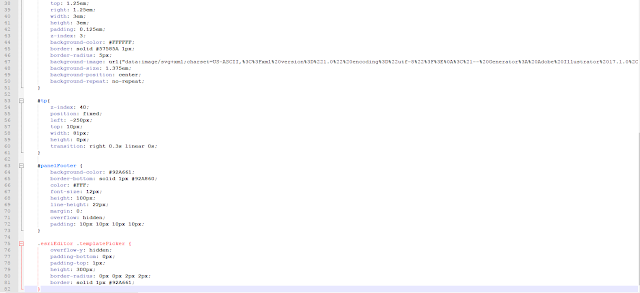 |
| Figure 14: CSS document (2/2). |
Lastly, the toggle functionality and parameters were established using a seprate JavaScript document (figure 15).
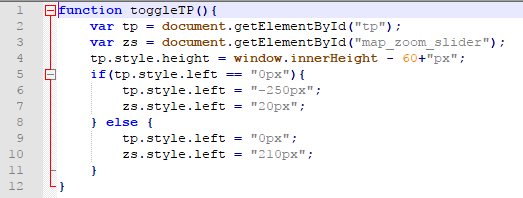 |
| Figure 15: Toggle JavaScript document. |
Results
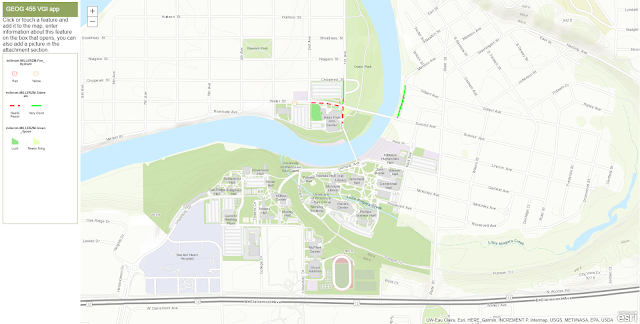 |
| Figure 16: First VGI webpage without toggle feature. |
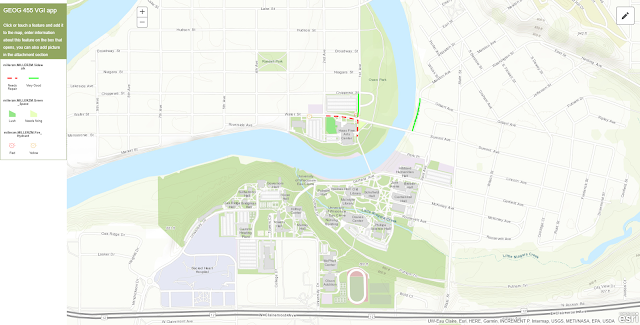 |
| Figure 17: Second VGI webpage with toggle feature. |
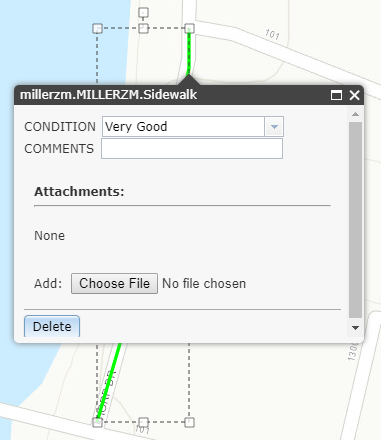 |
| Figure 18: Adding a feature to the map. |
Results
Using a VGI app or webpage could certainly have many useful applications. From the scenario used in this lab (updating fire hydrant, sidewalk, and/or green space information), to reporting crimes, there are quite literally infinite possibilities with VGI interfaces.
Although its use is relatively easy, the underlying code for this VGI was quite tricky to write. With multiple servers used and various languages/documents to keep track of, writing this script took some time. I felt as though the toggle feature didn't add much functionality to the application other than providing more screen space for mobile users.
Overall, this is a very useful technology that can provide access to everyday citizens of a place to improve their community, business, or project. With a little bit of time, access to ArcMap, and knowledge of coding, anyone has the ability to create and utilize a VGI interface.
Sources
Zach Miller
Dr. Cyril Wilson
ESRI


No comments:
Post a Comment